|
Quality Improvement, targeting at zero-defects, is based on a healthy Lean Kaizen style and on the intelligent use of a number of tools, generally called the "old and new quality tools". The very same tools are well suited for the overall enterprise's Performance improvement. They include, inter-alia:
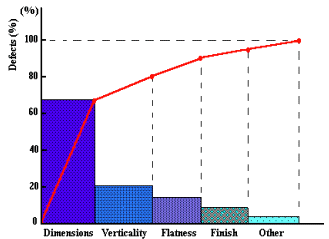
 The PARETO DIAGRAM, used to identify, quantify, and "weigh" the "entity" of quality problems and non-conformities, so that actions will be addressed there where the most beneficial results can be achieved. The PARETO DIAGRAM, used to identify, quantify, and "weigh" the "entity" of quality problems and non-conformities, so that actions will be addressed there where the most beneficial results can be achieved.
Normally, an ABC ANALYSIS is associated to a Pareto Diagram. This gives at a glance an indication of the "weight" or "entity" of phenomena.
The CAUSE-EFFECT DIAGRAM (Ishikawa Diagram - Fishbone Diagram).
 This is used to identify all causes and causes of causes (first, second, third.... level causes) that contribute or may contribute to generate the quality problem (negative effect) under consideration. This is used to identify all causes and causes of causes (first, second, third.... level causes) that contribute or may contribute to generate the quality problem (negative effect) under consideration.
By analysing all causes and by excluding the non-significant ones, eventually a number of "likely" causes are discovered.
These are thoroughly investigated, and, if actually contributing to generate the problem, eliminated once and forever with a poka-yoke method.
The RELATIONS DIAGRAM.
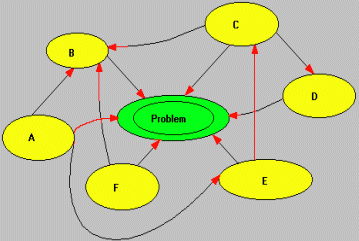
 In many instances, there is not a simple and linear relationship between causes and negative effect. It is in fact possible that a complex inter-relationship exists between causes, thus making more difficult their identification and positioning. In many instances, there is not a simple and linear relationship between causes and negative effect. It is in fact possible that a complex inter-relationship exists between causes, thus making more difficult their identification and positioning.
This is where the Relations Diagram comes very handy, allowing the Quality Improvement Team to highlight complex relationships between causes and investigate the "likely" ones.
The final target is always the permanent elimination of causes actually contributing to the quality problem.
Based on similar methods, but richer in features, are "thinking" tools such as the AFFINITY DIAGRAM and CEDAC (Cause and Effect Diagram with the Additions of Cards).
The target is always the identification of causes contributing to the undesired effect.
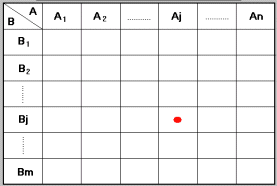
Several types of MATRIX DIAGRAM.
 These are extremely powerful tools when it comes to establishing complex relationships between causes and effects, in a "multi-cause-multi-effect" situation, e.g. when there are quality problems possibly inter-linked each other, and generated by a large number of inter-related causes. These are extremely powerful tools when it comes to establishing complex relationships between causes and effects, in a "multi-cause-multi-effect" situation, e.g. when there are quality problems possibly inter-linked each other, and generated by a large number of inter-related causes.
Relationships are not only identified but also "weighted" (to assign a "size" to each correlation between cause and effect).
3D Matrix Diagrams are used in very complex technical problem areas.
|

